
Materialdatenbank
Hier finden Sie praxisorientierte Aufgabenbeispiele für Ihren MINT-Unterricht!
Suchen und filtern Sie nach kostenlosen Materialien, Videos und Webinaren.

Arbeta med komplexa tal på din grafräknare
Kurs 4 - Arbeta med komplexa tal på din grafräknare
Publisher: Texas Instruments Sverige | Education Technology
Author: TI Sweden
Topic: Mathematics

RGB Array bargraph mathematical analyse
The mathematical analysis to start programming a RGB bargraph on the TI RGB array. The sensor value between 0 and 4096 is divided in a color range from red to orange to yellow and green.
Publisher: Franklin Neyt, Franklin Neyt
Topic: STEM
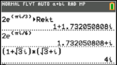
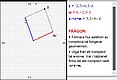
Complexe getallen TI-Nspire CX
Algemeen
Publisher: WIL-de Wiskunde
Author: WIL-de Wiskunde
Topic: Mathematics
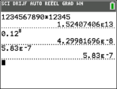
Complexe getallen TI-84 Plus CE-T
Algemeen
Publisher: WIL-de Wiskunde, T³ Nederland
Author: WIL-de Wiskunde
Topic: Mathematics
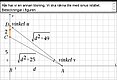
Räkneoperationer med komplexa tal
Ma 4 | Komplexa tal
Author: Texas Instruments Sverige | Education Technology
Topic: Mathematics
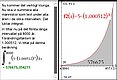
Ma 4 | Derivator och Integraler
Author: Texas Instruments Sverige | Education Technology
Topic: Mathematics
Ma 4 | Derivator och Integraler
Author: Texas Instruments Sverige | Education Technology
Topic: Mathematics

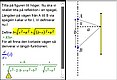
Tracker solaire avec TI-Innovator Hub et TI-83 Premium CE
Tracker solaire
Author: Texas Instruments France
Topic: Mathematics